The US Department of Agriculture (USDA) updated its plant hardiness zone scores in November 2023. This scale is one tool gardeners can use to determine if a plant can survive their region’s winter. The previous scores were based on temperature data from 1976 through 2005 and published in 2012. The revised map used temperatures from 1991 through 2020, which reflects the recent impact of Climate Change.
Methodology & History
The USDA system relies on a score based on the average lowest temperature for a given area. The first map, published in 1960, used ranges of 10°F (5.6°C). It went from Zone 1 (<-50°F) to Zone 10 (30°F to 40°F). The map was reissued in 1965 and again in 1990. The latter added more precision by creating ‘a’ and ‘b’ half-zones at the 5° F points. The ‘a’ half-zone represents the colder of the two. The 2012 edition added two new zones (12 & 13) at the higher end of the scale.
Limitations
While the USDA system uses actual data, it relies solely on the annual average extreme minimum and ignores other important climate factors. By relying on an average, the system doesn’t account for the variability in the minimum temperatures. Regions with the same score may also differ in the number of times that extreme temperature is reached. It’s much easier to protect a plant from a few cold nights than from weeks or even months. The model also ignores mitigating factors such as snow cover. Snow acts as an insulator, so lower-rated regions with reliable snow cover may support plants that don’t survive in warmer regions without snow cover. Other factors like humidity, hours of sunlight, soil type, and rain cycles play critical roles in plant survival.
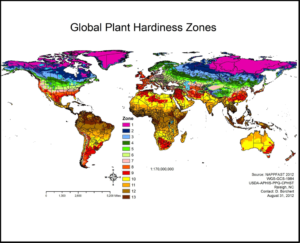
Some of these issues can be seen by looking at a global map using the USDA (2012) hardiness zones. This map comes courtesy of Tara Krause.
Other Systems
Australia developed a hardiness system with zones separated by 5°C. Canada also created a national system, but the government also publishes the USDA ratings, too. Gardeners can also use climate models like Köppen climate classification system. Introduced in the 19th century and refined in the 20th, the Köppen system offers general information (see link for more details). In 1966, Glenn Thomas Trewartha derived a modified version of Köppen. His system focuses more on plants, but like Köppen, it’s probably not local enough for gardeners.
Impact of Climate Change
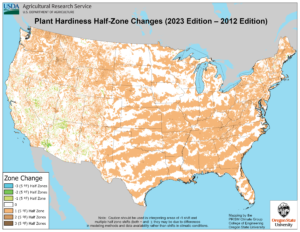
The latest USDA update reflects the increase in temperatures caused by climate change. Our featured map (courtesy of USDA and their partner Oregon State University) illustrates the change in the lowest extreme temperature between the 2012 and 2023 maps.
As always thanks for reading.
Armen
Note to pay the bills: My Warders series is filled with intrigue, magic, and adventure in a high fantasy world that’s appropriate for readers of all ages. Why not take a look? You can find a summary of the six book series here and links to purchase ebooks, print, and audiobooks editions here.
As an aside please consider signing up for my FREE author newsletter. It will contain opportunities to preview new books, announcements, and contests related to my novels. It will not overwhelm your inbox – I’m thinking once a month or less depending on news.
If you have subscribed, but haven’t received a newsletter, please check your spam folder. Moving the newsletter to your inbox should fix the issue.


